Economists, academicians for long have recognized the role of innovation in a country’s economic growth. National innovative capacity is defined as the ability of a country – as both a political and economic entity – to produce and commercialize a flow of innovative technology over the long term.
As India takes on its path of economic recovery, the time is apt to look at the state of innovation in India, reflected in its R&D capability. Though the growth of R & D services has been consistently high at around 20 % in the last few years, but India ranks low in its capacity for innovation as compared to developed nations as well as other BRICS nations. In the global gross expenditure on R&D (GERD) of US$ 1.6 trillion for 2014, India’s share is around 3 %, which is around five times lower than that of China.
The Economic Survey Report of India 2013-2014 has highlighted the current state of R&D services in India. A look at the following charts reveals the determinants of India’s innovative capacity and the opportunities for improvement in this area.
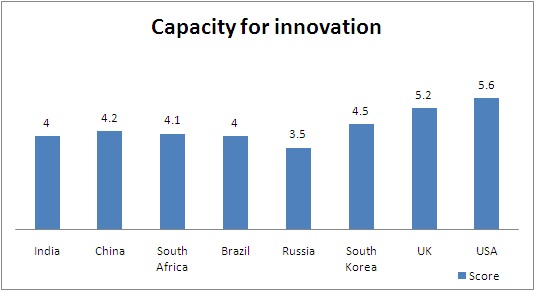
Capacity for innovation
According to the Global Competitiveness Report 2013-14 released by World Economic Forum in Sept 2013, India’s capacity for innovation has been lower than 3 of the other BRICS countries (Brazil, China, and South Africa).

- Data: Economic survey 2013-2014
University–industry collaboration on R&D
Though India scores better than China, Brazil, and Russia on quality of scientific research institutions, its poor score on university–industry collaboration on R&D as compared to some other BRICS nations like China and South Africa, indicates that research undertaken in such institutions is not percolating down for commercial usage.
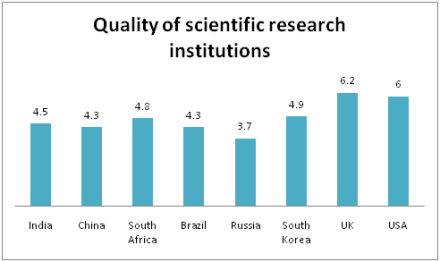
- Data: Economic survey 2013-2014

No comments:
Post a Comment