Showing posts with label Markets. Show all posts

Thursday, 19 December 2013

Beginning of Fed Taper - Impact on India and other Emerging Markets


Two major events scheduled on the 18th of December, were seen as deciding factors for the stock market movement in India by the end of 2013.

First was the announcement of monetary policy by the Reserve Bank of India (RBI) governor. Raghuram Rajan beat the market expectations of a hike in interest rates and surprised the markets pleasantly with no changes to the current monetary policy. RBI kept the repo rate unchanged at 7.75 % , the reverse repo at 6.75%, the cash reserve ratio at 4% and the marginal standing facility and the bank rate at 8.75%. Markets reacted favorably to the announcement.

taper


Later on the same day, US Federal Reserve Chairman Ben Bernanke initiated pullback from Quantitative Easing (QE) before the end of his term in 2014 with Janet Yellen taking over as the Chairperson of Federal Reserve. The size of the taper, $10 bn was in line with what the market had expected back in September, 2013. The announcement saw the US markets shooting up. DJIA closed up by more than 1.84%, Nasdaq by 1.15%, S&P  500 by  1.68 % respectively. The day after, Asian markets reacted to the taper with Japan's Nikkei rallying while Hong Kong, Shanghai and Indian markets swinging between gains and losses. The European stocks rallied to US Fed taper.

In the Federal Open Market Committee (FOMC) quarterly meet held on 19th June, 2013, Fed Chairman Ben Bernanke had first given an indication about the potential reduction in Fed’s bond buying program, subject to improvement in the US economy. Some of the indicators of economic recovery considered were unemployment target (at 7 percent), targeted inflation rate (at 2 percent) and economic growth (between 2.3 - 2.6 percent) for 2013. The announcement had sent jitters in the world markets and laid bare the tremendous impact that decisions about the US monetary policy, have on markets all over the world.

The Federal Reserve had adopted an expansive monetary policy, since 2009, with the objective to spur economic growth in the US. After the financial crisis of 2008, Fed had rolled out new emergency lending programs to bail out the banks and had lowered the federal funds interest rate from 2 % to a range between 0 and 0.25 %. When the interest rates could not be further lowered, Fed started the first round of QE in March 2009 to help revitalize mortgage lending and support the housing market by increasing the availability of credit in private markets.

The second round of QE by Fed, began in November 2010, to strengthen the economic recovery and protect the economy from falling into deflation. In September 2011, Fed stepped up its purchases of Mortgage Backed Securities (MBS) and on September 13, 2012, the Fed announced QE3, thus adding a total $85 billion of liquidity a month.

The rise in liquidity in the US market due to Quantitative Easing saw money flowing into Emerging markets as US investors invested in these stock markets in search for higher returns. Inflows from Foreign institutional investors (FIIs) in Indian markets stood at $24.54 billion in 2012. In 2013, FIIs have infused around $18.7 billion into Indian equities so far in 2013.

Uneasiness crept into the world markets in June 2013, after Ben Bernanke hinted of starting a gradual withdrawal of QE by the end of the year if the economic data supported the story of improvement in the US economy. The investors, having gotten used to the excess liquidity, became very concerned about the end of Federal Reserve's accomodative policy stance and thus stock markets started exhibiting higher volatility in anticipation of start of taper.

Throughout the year Ben Bernanke was seen managing the expectations of the markets and investors, and giving assurances to start reducing its bond-buying program in a manner that would cause minimal disruption to the markets. In their previous policy meet in September, 2013 FOMC surprised the markets by delaying the taper when the market was almost prepared for it. As a result most markets were exuberant and picked up the upward momentum again. FIIs resumed buying into the Indian markets in September.

In its last policy meet for 2013 on 18th December, FOMC surprised yet again, albeit partially, as they chose to go ahead with the taper when only a minority was expecting it. Fed stated that the decision to reduce its monthly bond purchases by $10 billion was taken in light of:
  • Improvement in the US job market.
  • Easing of Fiscal restraint.
  • Expected increase in inflation up to 2%.
As a counterweight to try to avoid a very bearish market reaction, the FOMC maintained a dovish forward guidance and said that they to expect to keep the funds rate at zero until well past the unemployment hits 6.5 percent.The first rate hike is not likely to happen until 2015, according to the projections released by the FOMC.

Under the leadership of Yellen, if Fed continues to pull back on it stimulus, the markets may begin to perform more in line with economic fundamentals and the returns could diminish. The impact might be felt worldwide as the US investors investing in other countries may take money out of those markets to invest in the US. Besides, the fact that the US dollar plays a crucial role in international markets, makes the markets extremely sensitive to any policy that impacts the dollar. The effect of outflow could be pronounced in the emerging nations which depend on dollar inflows to finance their current account deficits. The currencies of the Emerging Markets, may face risk of further depreciation if large outflows take place from these countries.

With the currency stabilizing and the improvement in the current account deficit (CAD) , we hope that impact on the Indian market remains muted in the year 2014.


Thursday, 12 December 2013

Ten Most Traded Currencies in the World in 2013


Notwithstanding the fact that trading foreign exchange on margin carries a high level of risk, the world’s largest market with 24-hour market action is the currency trading market.

There are more than 190 countries in the world with currencies that can be traded, of course, subject to government restrictions. The value of daily foreign exchange trading exceeds the value of annual international trade in goods and services by more than one hundred times.

The cumulative share in daily currency trading of the top ten currencies is about 180 percent and the rest of the currencies in the world have a share of 20 percent.  (Since two currencies are involved in each transaction, the sum of the percentage shares of individual currencies totals 200% instead of 100%.)

As per reports of The Bank for International Settlements, which is an international organization of central banks, these are the top ten traded currencies of the world in 2013.


Rank
Currency
CountryShare of trade (%)
1US DollarUSA87.0
2EuroEurope33.4
3YenJapan23.0
4British PoundGreat Britain11.8
5Aus DollarAustralia8.6
6FrancSwitzerland5.2
7Canadian DollarCanada4.6
8Mexican PesoMexico2.5
9YuanChina2.2
10NZ DollarNew Zealand2.0


1

The U.S. Dollar


Nearly 87 percent of the transactions in foreign exchange markets involve the dollar.
The US Federal Reserve System was established in 1913 as the central banking system of the United States to keep up with the changing financial needs of the country. The Federal Reserve Board created a new currency called the Federal Reserve Note. The first federal note was issued in the form of a ten dollar bill in 1914.


Euro

2

The Euro

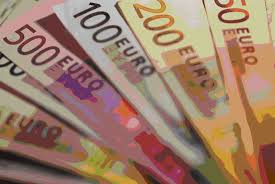
Even though it was introduced in 1999, the euro became the second highest-traded currency in the world with a 33 percent share in daily transactions.
In 1998, the European Central Bank was established. The euro was introduced in 1999 as the new common currency for 11 Member States including Belgium, Germany, Ireland, Spain, France, Italy, Luxembourg, the Netherlands, Austria, Portugal and Finland. The euro is not the currency of all EU Member States. Denmark and UK have not adopted Euro as their currency and some EU member countries are yet to meet the conditions for adopting the single currency.


Yen

5

The Japanese Yen


With a share of over 23 percent of the daily currency transactions, the Yen takes the #3 spot.
The history of the yen goes back to 1871 when it was adopted officially as the Japanese currency by Japan's Meiji government. In 1882, the Bank of Japan was established under the Bank of Japan Act as the country’s central bank.


GBP

4

The British Pound

The British pound has a share of almost 12 percent in daily currency trades. The official name of the currency is pound sterling. As one of the oldest central banks in the world, the Bank of England was founded in 1694 to act as the government’s banker and debt-manager.
It began issuing notes the same year, where notes had a few lines of engraved text, promising to pay a specified sum at the Bank's premises with spaces for a handwritten date, number, signature, and the name of the payee.


AUD

5

The Australian Dollar

This currency has over 8.6 percent share in daily currency transactions.
Till 1924, the Australian Department of the Treasury was in charge of issuing notes. In 1924, the Commonwealth Bank of Australia was given control over the issue of currency note.

...


Swiss Franc

6

The Swiss Franc

With over 5.2 percent of daily currency transactions, the Swiss franc takes the sixth spot.
Until the mid-19th century, cantons (states or provinces) and other entities were producing their own currency.  The Swiss National Bank was established after the introduction of the Federal Act on the Swiss National Bank in 1905. In 1910, the Swiss National Bank received its monopoly position in issuing money.


CAD

7

The Canadian Dollar

As the #7 currency in the world, the Canadian dollar has 4.6 percent share in daily currency transactions in the world.
The idea that government should issue currency started gaining support in the mid nineteenth century, but it was only in March 1935 that the Bank of Canada officially started its operations as the country’s central bank.

Peso

8

The Mexican Peso

The Mexican Peso has a 2.5 percent share in daily foreign exchange transactions and has been the currency of Mexico since the country got independent in 1821.
But Peso was first introduced into Mexico by the Spanish. Till 1785, it spread over almost all of the North America and gained status as the official currency system including United States.
Mexican currency is managed and issued by the central bank of the country i.e. Bank of Mexico.


CNY Yuan

9

The Chinese Yuan

With a 2.2 percent share in daily foreign exchange transactions, the yuan became one of the top 10 traded currencies in 2013, rising to No. 9 on the list due to a "significant expansion" in offshore trading, according to a report released by the Bank for International Settlements.
It's a sharp jump from the bank's last survey in 2010, when the yuan, known in China as the renminbi or "people's money," was No. 17 on the list.
China's central bank, People's Bank of China (PBOC) was established in 1948.

NZD

10

The New Zealand  Dollar

With 2 percent share in daily currency transactions,
the New Zealand dollar takes the #10 spot in the countdown.
New Zealand became a British colony in the mid-19th century.
The national currency was introduced in 1934 and, shortly after, the Reserve Bank of New Zealand (the country’s central bank) was created.


Source:
http://www.cbc.ca/news/business/chinese-yuan-among-top-10-most-traded-currencies-1.1703612


You may also like to read
Currency crisis in the Emerging Markets

Friday, 29 November 2013

Understanding random market behaviour


For an investor, the pain of selling a stock at a loss far exceeds the pleasure of selling the stock at an equal amount of gain.
Strange but true!
Such behavioral aspects of investing and many more are brought out in the study of behavioral finance, that was introduced in the late 1980s, owing to anomalies in stock price prediction by the two main existing theories of academic finance, i.e. Modern Portfolio Theory’ and ‘Efficient Market Hypothesis’.

According to the ‘Efficient Market Theory’, put forth by Eugene Fama, financial markets are believed to be efficient and investors are understood to make rational decisions. Further, market participants are supposed to be sophisticated, informed and known to act only on available information. Since market participants are believed to have equal access to information, it is implied that stock prices always reflect the best information about fundamental values of the stocks. According to the efficient market theory and Capital Asset Pricing Model (CAPM) the price of a stock is the Present Value (PV) of all the entire future earnings of the company i.e. the future dividend paid by the company. 

The ‘Modern Portfolio Theory’ pioneered by Harry Markowitz suggested that an investor can maximise returns by holding a diversified portfolio of assets with different levels of risk.

However stock prices were found to exhibit more volatility than efficient market hypothesis could explain.  The market price of a stock often grossly varied from the price arrived at by efficient market theory.  This unexplained volatility and the difference between the market price and the rational price of the stock became a subject of research. It was also found that as compared to the individual stocks, the aggregate stock price (index) showed a higher variance from the values predicted by the efficient market theory.

The research brought out interesting aspects of behavioural finance. In the paper ‘From efficient market theory to behavioral finance’, Robert J Schiller explains the reason for the apparent randomness in the movement of stock prices using models such as feedback model, smart money versus ordinary investors and prospect theory.

Feedback model

As expectations of rise in a stock price increase, more and more people start buying the stock. As a result a momentum sets in, which takes prices farther away from the levels predicted by the academic finance models. Similarly when there is an expectation of a fall in price, more and more people join in to sell the stock, driving prices lower than supported by the financial models. This is one of the strong reasons for bubbles and bursts. Feedback may be one of the essential sources of the randomness seen in stock prices.

Obstacles to smart money

Recognizing the difference between smart money and the ordinary investors, the efficient markets theory asserts that when the irrational optimist buys a stock, the smart investor sells and vice versa. However in reality every investor has the shades of an ordinary investor and a smart investor.  Many times when most owners of a stock are too optimistic about a stock, they may not be willing to lend shares to short sellers; so there may not be enough shares available for short selling.  The lack of short selling can push the stock price further upwards, amplifying  the effect of irrational optimism and can cause financial anomalies in bubbles and bursts.  

Prospect Theory

Prospect theory is used to explain deviations from the traditional paradigm of rational behaviour. According to this theory since people value gains and losses differently, an investor feels more difficulty in selling shares at a loss than the exuberance the person experiences when selling the stock at an equal amount of gain.


Understanding how other market participants may act can help investors in making good investment decisions. Traders often experience a varied range of emotions from exuberance to despair during different stages of a trade with abrupt changes in the stock price movement, with negative emotions weighing much heavily than the positive emotions. Viewing the random and unexpected market movement in light of behavioral finance theory can prepare investors better to ride out the volatility by inculcating trading discipline, while minimizing the emotional impacts. It can prevent investors from buying overpriced shares or from dumping oversold but still valuable stocks at a huge loss seeing other investors rushing for the exits and thus avert committing gross wrong trades that are to be regretted later.


Saturday, 31 August 2013

Currency crisis in the Emerging Markets


The year 2013 has seen a global sell off resulting in the fall of currency in most emerging markets including Brazil, India, South Africa, Indonesia and Turkey. The charts below show the currency movement of the emerging nations versus the US Dollar in the last 5 years. (Source: http://www.xe.com/currencycharts )


Brazilian Real has fallen more than 14%  against the USD.


Indian Rupee has fallen about 20% against the dollar in 2013 and hit a lifetime low 68.85 per USD.


South African Rand hit the R10/$-mark for the first time since 2009, the lowest value in four years as poor economic data and labor market tensions weighed on sentiment.


Indonesian Rupiah has slid nearly 12% in 2013.


The Turkish Lira has fallen to a record low of 2 to the US Dollar, the lowest level record since 1981.


The under performance of these currencies can be attributed to the widening of the current account deficit in these countries including Brazil, India, South Africa, Indonesia and Turkey, with the CAD/ GDP ratio exceeding the levels set by the respective governments. The anticipation of the reduction in the US Federal Reserves’s stimulus program from September 2013, is causing outflow of foreign money from the emerging markets  into the United States, resulting in a further weakening these currencies.


In contrast, Chinese Yuan Renminbi has seen an appreciation in the corresponding period. Economists attribute it to high foreign exchange reserves and lower dependency on hot money inflows. 


The fallout of the depreciation can be felt in the rising costs of imports, increasing prices of petroleum products, fertilizers, commodities and loss of purchasing power due to inflation. The borrowers in these countries with dollar-denominated loans may not be able to pay back the loans, thereby increasing the default rates.

While the government and central bankers are taking measures to arrest the depreciation of their currencies by raising interest rates, curbing imports and tightening monetary policy and regulators are taking steps to reduce arbitrage opportunities and speculations in the currency markets, the overall remittances to some of these countries, particularly India has seen a jump, with Non-Resident Indians (NRIs) remitting more money to India, taking advantage of the depreciating rupee.  


Wednesday, 27 March 2013

Markets - On the Roller Coaster


The excessive market euphoria that was apparent in the beginning of the month has faded and has given way to apprehensions for investors worldwide.

Even as the markets seemed to recover from the concerns over Cyprus bank run, tagging it a one off event, the news of political turmoil in Italy shook the European stock markets. Greece's ATHEX Composite was off 4.8%. US indexes opened in red today. This certainly signals nervousness and dampened sentiments of investors. The Asian markets will also be impacted negatively.

Bank deposits that were so far considered as safe investment options, no longer seem to be safe after the Cyprus government decided to levy taxes on deposits, in a bid to secure bailout package from the European Union. The banks have remained closed for about a week and are likely to reopen with the imposition of capital controls by Cypriot authorities. This will limit the ability of the customers to access and withdraw money for a certain period of time, and thus save the banks from bankruptcy. Either ways it is a no-win situation. A bailout deal will send the country into recession, encourage small investors to hoard cash, and prompt foreign depositors to shift to other investment bases.

The fear that banking crisis may spread over to other European countries has spooked the investors. Adding another element of uncertainty to Euro Zone, is the inability of Italian politicians so far, to put together a new coalition government since parliamentary elections in late February. All these factors put together may cause a decrease in the inflow of global funds arising from the loss of investor confidence in the Euro Zone.

In India too, the United Progressive Alliance (UPA) coalition government may find it difficult to sustain due to withdrawal of support from alliances, thus creating conditions for early elections. After DMK pulled out of the  last week, the Samajwadi party has threatened to withdraw support too. If the Foreign Institutional Investors perceive that the Indian government will not have with enough bandwidth to carry out the envisaged and much needed economic reforms this year, then India too will see a decrease in the inflow of FII funds, which provide liquidity to the market.

As the sentiments have turned pessimistic, global markets will look up to political stability and announcement of measures for risk / crisis management to continue with the further run. 

Thursday, 7 March 2013

Global Markets - Riding high on sentiments


Worldwide markets are echoing bullish sentiments.

The US Dow Jones Industrial Average index has surpassed its 2007 high and continues to make new all-time highs. The Standard & Poor’s 500 Index too is trading at post-2007 highs. Asian & European markets are rallying too based on cues from the US market. Indian markets are recovering from February lows.

All this barely a week after the US sequestration set in on March 1, 2013!!
The bullish markets have revived positive sentiments and created excitement, but it also warrants cautiousness. In wake of the upsurge, the markets appear to be discounting all negative news and taking ahead the rally based on selective good news or on expectations of continued monetary easing by the respective Central Banks.

The US market has chosen to focus on and celebrate the news of drop in US jobless claims monthly average to a 5 yr low, while ignoring the data that US trade deficit has widened in January to $44 billion and the US year end productivity has dropped to 1.9%, the biggest decline since 2008. As per the Sequester, about $85 billion in spending reductions will automatically occur in US by the end of Fiscal Year 2013.

The UK market was up on hope of cut in interest rates by Bank of England (BOE). UK’s manufacturing sector has contracted and this posses a major challenge for UK’s economy. BOE left its key lending rate unchanged in March. The European stock markets fell marginally after the European Central Bank kept rates on hold as expected.

Bank of Japan too kept its policy unchanged and decided not to step up monetary stimulus. Nikkei has been trading strong.

In India, on 28th Feb, the Finance Minister had presented the annual budget, aimed at reducing the widening fiscal deficit by cutting down government expenditure, increasing revenue and promoting growth. The quarterly GDP growth figure has slipped to 4.5%, the lowest in a decade. The market crashed after the budget speech was delivered by the Finance Minister, but recovered in the 1st week of March, following global cues. The uptrend may remain intact if the global markets are up as the speculation build up around Reserve Bank of India cutting interest rates to spur growth.

The markets are climbing higher, raising the hope that maybe the worst is behind us. But the question is whether the new highs will hold and for how long, particularly when the rally seems to be based more on market optimism rather than fundamentals. 

Thursday, 22 November 2012

Market Reaction to new CEO announcement

On 21st Nov, Indian generic drug maker Cipla Ltd. announced its plans to acquire South African firm  Cipla Medpro. Subsequent to the announcement that is likely to boost its prospects in Africa, and is expected to be accretive to earning, Cipla Ltd. shares rose by more than 3 % after the announcement and were trading at Rs 390 on NSE.

On 22nd Nov, Cipla Ltd announced the appointment of Mr. Subhanu Saxena as Chief Executive Officer. Mr. Saxena has rich work experience of over 25 years, in industries as varied as FMCG, consulting, banking and pharmaceuticals. Following the announcement of the appointment of new CEO, Cipla share fell down during the day while the NIFTY index showed a upward movement. Cipla share price clearly did not follow the pattern in sync with the movement of NIFTY. 

This weak movement of the share price on 22nd Nov could have something to do with the announcement of new CEO appointment. Generally some market reaction is expected around the announcement day of a CEO appointment. In considering CEO candidates, boards of directors and selection committees are almost always concerned about the market reaction on the company’s share price.

At times markets tend to react unfavourably to the announcement of a new CEO, as investors may anticipate some amount of uncertainty involved with the change in CEO. There are other instances when there have been positive abnormal returns around the announcement of an outside CEO appointment. In such cases, results suggest that new outsider CEO appointments can be considered as beneficial to investors because they bring in knowledge from other organizations and can objectively evaluate and challenge the current strategy of the company and incorporate new and fresh ideas
.
Though the initial market reaction is in anticipation of  the CEO’s likelihood of success, however a  latest research by HBR shows that there is no positive correlation between how a company’s stock fares upon the announcement of a new CEO and the share price over that CEO’s tenure so the initial market reaction should not be considered an indicator of the CEO's likely performance.

Irrespective of the initial market reaction, it will only be evident over a period of time how the new CEO steers the Cipla towards higher levels of growth and creates value for the shareholders.