Saturday, 28 December 2013

Salary Comparison for Project Management Professionals in 2013


The median salary of Project Management Professionals has been found to vary with a number of key demographic factors, as per a '2013 Salary Survey' report published by Project Management Institute, PMI, US.  These include factors such as:
  • Country of employment
  • Number of years experience in project management
  • Position/Role
  • Average size of projects managed, including average project budget and average project team size
We present the comparison of salary information for 10 countries from the PMI report.

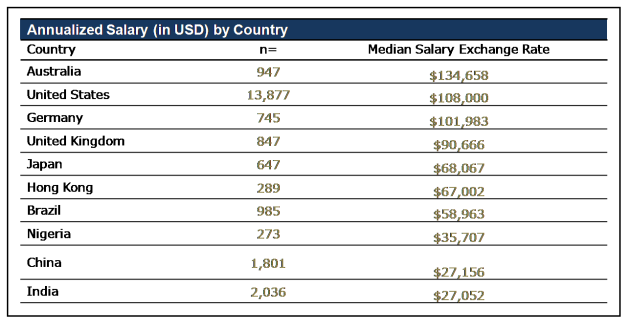
Country of Employment

The median salary for project management professionals vary widely from country to country.  The country with the highest median salary ($134,658 USD) is Australia, whereas India and China are amongst the countries with the lower range of median salary (around $27,000 USD).

Country


Position

Within the various levels of project managers, salary appears to increase with added responsibility as a person proceeds from being a Project Manager, to a Program Manager, to Portfolio Manager, to the Director of a Project Management Office. There are some exceptions to this order though. In Germany the salary of Director of PMO is less than the salary of Portfolio Manager. The differential salary increase between different levels appears to be low in Japan, China and India.


Position


.


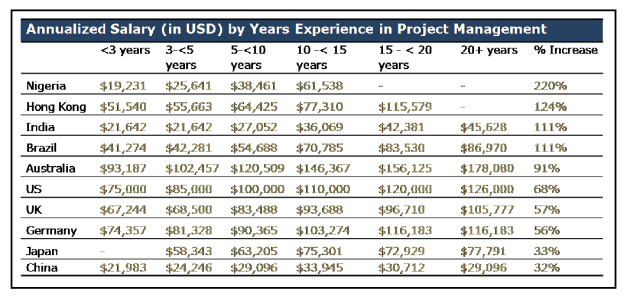
Number of Years Experience in Project Management

The number of years a person has worked within the project management profession has a direct positive correlation with the salary. Again the difference in median salary varies by country.  A dramatic increase is seen in Nigeria.  The median salary ranges from $19,231 (USD) for those just starting out in the project management field to $61,538 (USD) for those who have been in the field for 10 -15 years.  This represents an increase of nearly 230% from low-to-high experience in the field.  The difference in median salary is not as striking in China.
Experience


.

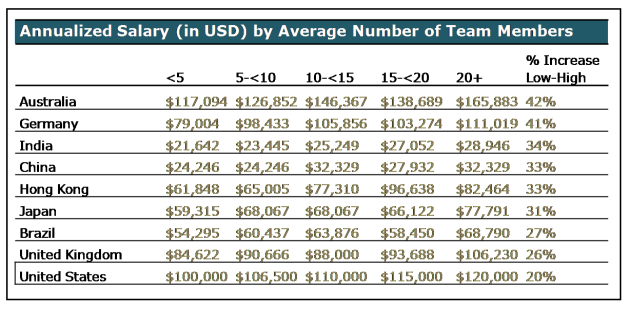
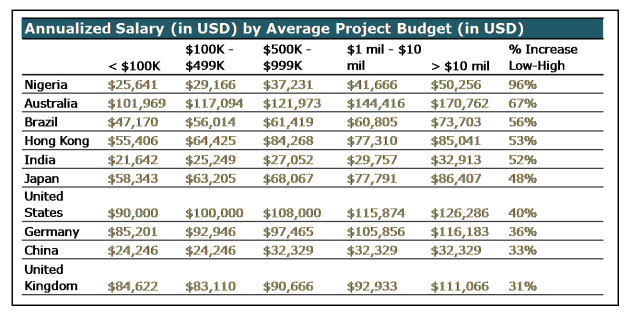
Project Size (Average No of Team Members and Project Budget)

The size of projects managed, in terms of average number of team members and average project budget, also appears to have a positive correlation with annual salary.
In Nigeria, those managing projects with budgets of $10 million or more earn 96% more than those with projects under $100,000. In Japan and India the figure is around 50% more. In Japan, China and India those managing projects with larger teams (20 or more people) have a median salary that is 30 - 34% higher than those managing teams of 1 to 4 people.
TeamMem


Budget


Thursday, 19 December 2013

Beginning of Fed Taper - Impact on India and other Emerging Markets


Two major events scheduled on the 18th of December, were seen as deciding factors for the stock market movement in India by the end of 2013.

First was the announcement of monetary policy by the Reserve Bank of India (RBI) governor. Raghuram Rajan beat the market expectations of a hike in interest rates and surprised the markets pleasantly with no changes to the current monetary policy. RBI kept the repo rate unchanged at 7.75 % , the reverse repo at 6.75%, the cash reserve ratio at 4% and the marginal standing facility and the bank rate at 8.75%. Markets reacted favorably to the announcement.

taper


Later on the same day, US Federal Reserve Chairman Ben Bernanke initiated pullback from Quantitative Easing (QE) before the end of his term in 2014 with Janet Yellen taking over as the Chairperson of Federal Reserve. The size of the taper, $10 bn was in line with what the market had expected back in September, 2013. The announcement saw the US markets shooting up. DJIA closed up by more than 1.84%, Nasdaq by 1.15%, S&P  500 by  1.68 % respectively. The day after, Asian markets reacted to the taper with Japan's Nikkei rallying while Hong Kong, Shanghai and Indian markets swinging between gains and losses. The European stocks rallied to US Fed taper.

In the Federal Open Market Committee (FOMC) quarterly meet held on 19th June, 2013, Fed Chairman Ben Bernanke had first given an indication about the potential reduction in Fed’s bond buying program, subject to improvement in the US economy. Some of the indicators of economic recovery considered were unemployment target (at 7 percent), targeted inflation rate (at 2 percent) and economic growth (between 2.3 - 2.6 percent) for 2013. The announcement had sent jitters in the world markets and laid bare the tremendous impact that decisions about the US monetary policy, have on markets all over the world.

The Federal Reserve had adopted an expansive monetary policy, since 2009, with the objective to spur economic growth in the US. After the financial crisis of 2008, Fed had rolled out new emergency lending programs to bail out the banks and had lowered the federal funds interest rate from 2 % to a range between 0 and 0.25 %. When the interest rates could not be further lowered, Fed started the first round of QE in March 2009 to help revitalize mortgage lending and support the housing market by increasing the availability of credit in private markets.

The second round of QE by Fed, began in November 2010, to strengthen the economic recovery and protect the economy from falling into deflation. In September 2011, Fed stepped up its purchases of Mortgage Backed Securities (MBS) and on September 13, 2012, the Fed announced QE3, thus adding a total $85 billion of liquidity a month.

The rise in liquidity in the US market due to Quantitative Easing saw money flowing into Emerging markets as US investors invested in these stock markets in search for higher returns. Inflows from Foreign institutional investors (FIIs) in Indian markets stood at $24.54 billion in 2012. In 2013, FIIs have infused around $18.7 billion into Indian equities so far in 2013.

Uneasiness crept into the world markets in June 2013, after Ben Bernanke hinted of starting a gradual withdrawal of QE by the end of the year if the economic data supported the story of improvement in the US economy. The investors, having gotten used to the excess liquidity, became very concerned about the end of Federal Reserve's accomodative policy stance and thus stock markets started exhibiting higher volatility in anticipation of start of taper.

Throughout the year Ben Bernanke was seen managing the expectations of the markets and investors, and giving assurances to start reducing its bond-buying program in a manner that would cause minimal disruption to the markets. In their previous policy meet in September, 2013 FOMC surprised the markets by delaying the taper when the market was almost prepared for it. As a result most markets were exuberant and picked up the upward momentum again. FIIs resumed buying into the Indian markets in September.

In its last policy meet for 2013 on 18th December, FOMC surprised yet again, albeit partially, as they chose to go ahead with the taper when only a minority was expecting it. Fed stated that the decision to reduce its monthly bond purchases by $10 billion was taken in light of:
  • Improvement in the US job market.
  • Easing of Fiscal restraint.
  • Expected increase in inflation up to 2%.
As a counterweight to try to avoid a very bearish market reaction, the FOMC maintained a dovish forward guidance and said that they to expect to keep the funds rate at zero until well past the unemployment hits 6.5 percent.The first rate hike is not likely to happen until 2015, according to the projections released by the FOMC.

Under the leadership of Yellen, if Fed continues to pull back on it stimulus, the markets may begin to perform more in line with economic fundamentals and the returns could diminish. The impact might be felt worldwide as the US investors investing in other countries may take money out of those markets to invest in the US. Besides, the fact that the US dollar plays a crucial role in international markets, makes the markets extremely sensitive to any policy that impacts the dollar. The effect of outflow could be pronounced in the emerging nations which depend on dollar inflows to finance their current account deficits. The currencies of the Emerging Markets, may face risk of further depreciation if large outflows take place from these countries.

With the currency stabilizing and the improvement in the current account deficit (CAD) , we hope that impact on the Indian market remains muted in the year 2014.

Monday, 16 December 2013

Collaborative Attitude or Individual Brilliance


Source:   www. cutcaster.com
Source: www. cutcaster.com


Collaborative attitude vs. individual brilliance has always been a matter of debate. The subject elicits different responses depending on the socio-cultural context.

Countries like Japan, with team driven culture, have made remarkable progress in technology, thanks to their collaborative attitude. The American system and the European systems have been able to drive innovation with the help of their educational and legal frameworks that allow for collaboration between various people, encourage out of the box thinking and risk taking.

In the Indian society though individual brilliance is highly admired, but team working skills do not receive the desired consideration. That often impedes the output. The advent of electronic gadgets, internet (strangely yes!), increase in nuclear families and increased urbanization have further reduced the social interactions.Nowadays we are seeing that kids increasingly prefer to be confined to their homes playing with gadgets instead of going out to play. In the public transports, people remain glued to their phones, tablets, kindles, etc. rather than talk with their fellow travelers.  The reduction in social interactions may further deteriorate the collaborative skills and team working abilities.

Additionally, the education system plays an important role in shaping up the skills and attitude. The Western education system and some other education systems like the Japanese system focus on building up specific skills and concept learning which fosters a culture of innovation and higher productivity while the education systems in India and in some other Asian countries promote verbatim learning that does not leave much space or freedom for creativity.

The legal system too determines attitude towards work by providing mechanisms for protecting original pieces of work e.g. protection of patents, trademarks, strict laws against plagiarism etc.

If you look at the global business scenario, though some organizations are leaning towards providing work from home facility to their employees to  reduce their cost of operations, but most others believe that productivity increases in an ecosystem that encourages more social interactions between the people.

Apple and Microsoft are designing offices in which people bump into each other more and exchange ideas. Yahoo has banned employees from working from home so that employees work more effectively by having more face to face interactions rather than by using more efficient means like email, phones, etc. Jack Welch, as GE insiders say, would look at the body language and commitment exuded by the manager presenting new ideas rather than look only at the details of the plans.

One of my senior business acquaintances who hails from Korea told me that two things are very important to succeed and drive changes and innovation in an organization – team work and passion. While passion comes from within, people who can work and contribute to a group effort are very important to organizations which in turn have to build up ecosystems to nurture group efforts. He also mentioned that humans who can use their left and right brains equally well are more productive than single brained humans. The left side of the brain is used in structured and analytical work while the right side of the brain is used for instinctive work like arts, sports, etc.

The need for collaboration is further corroborated by an American research finding. In a Scientific American, article  " The limits of intelligence” published in July 2011, Douglas Fox claims that the human brain has reached its limits of intelligence. Now, this sounds counter-intuitive because if the human brain can`t get any better, then how can human output increase in this age of “innovation”.

Fox says that one way is by better social interaction leading to a collective pooling of human brain and the second way is by use of technology (viz. internet).

.

Thus, social interactions facilitated by culture and technology can actually reduce the need for greater individual smart brains!


.
This information based on the research has very important ramifications for organizations, institutions, societies, etc. which are highly influenced by human behaviours.
  • One man army teams, teams with rock stars and high calibre people who can`t gel in a team will have limitations beyond a particular point. As the saying goes – “the whole is better than sum of the parts”.
  • Well rounded personalities would be preferred as compared to uni- dimensional personalities in managerial positions. In an organization a person with high IQ but average – low EQ would be a disaster. Highly left brained or right brained people would find it difficult to contribute to an overall cause beyond a limit.
  • To identify the correct people, organizations would need to have robust recruitment and training processes. People in managerial posts would need to have interests in varied activities like sports, arts, music, etc. to be effective managers.
  • The education system would need to be modified to stress not only on academics but also in extracurricular activities and sports. Rote based systems need certainly to undergo rigorous changes to suit the new challenges in a global system.
  • Women managers would need to be given more positions of responsibility as generally they are better off in team work and more well-rounded and balanced personalities as compared to men.

As my Korean friend said

“Team work” and “Passion” are some of the most important aspects in life.

How true!!
-       Contributed By Ram Narayanan, Sloan Fellow, London Business School

You may also  like to read

Thursday, 12 December 2013

Ten Most Traded Currencies in the World in 2013


Notwithstanding the fact that trading foreign exchange on margin carries a high level of risk, the world’s largest market with 24-hour market action is the currency trading market.

There are more than 190 countries in the world with currencies that can be traded, of course, subject to government restrictions. The value of daily foreign exchange trading exceeds the value of annual international trade in goods and services by more than one hundred times.

The cumulative share in daily currency trading of the top ten currencies is about 180 percent and the rest of the currencies in the world have a share of 20 percent.  (Since two currencies are involved in each transaction, the sum of the percentage shares of individual currencies totals 200% instead of 100%.)

As per reports of The Bank for International Settlements, which is an international organization of central banks, these are the top ten traded currencies of the world in 2013.


Rank
Currency
CountryShare of trade (%)
1US DollarUSA87.0
2EuroEurope33.4
3YenJapan23.0
4British PoundGreat Britain11.8
5Aus DollarAustralia8.6
6FrancSwitzerland5.2
7Canadian DollarCanada4.6
8Mexican PesoMexico2.5
9YuanChina2.2
10NZ DollarNew Zealand2.0


1

The U.S. Dollar


Nearly 87 percent of the transactions in foreign exchange markets involve the dollar.
The US Federal Reserve System was established in 1913 as the central banking system of the United States to keep up with the changing financial needs of the country. The Federal Reserve Board created a new currency called the Federal Reserve Note. The first federal note was issued in the form of a ten dollar bill in 1914.


Euro

2

The Euro

Even though it was introduced in 1999, the euro became the second highest-traded currency in the world with a 33 percent share in daily transactions.
In 1998, the European Central Bank was established. The euro was introduced in 1999 as the new common currency for 11 Member States including Belgium, Germany, Ireland, Spain, France, Italy, Luxembourg, the Netherlands, Austria, Portugal and Finland. The euro is not the currency of all EU Member States. Denmark and UK have not adopted Euro as their currency and some EU member countries are yet to meet the conditions for adopting the single currency.


Yen

5

The Japanese Yen


With a share of over 23 percent of the daily currency transactions, the Yen takes the #3 spot.
The history of the yen goes back to 1871 when it was adopted officially as the Japanese currency by Japan's Meiji government. In 1882, the Bank of Japan was established under the Bank of Japan Act as the country’s central bank.


GBP

4

The British Pound

The British pound has a share of almost 12 percent in daily currency trades. The official name of the currency is pound sterling. As one of the oldest central banks in the world, the Bank of England was founded in 1694 to act as the government’s banker and debt-manager.
It began issuing notes the same year, where notes had a few lines of engraved text, promising to pay a specified sum at the Bank's premises with spaces for a handwritten date, number, signature, and the name of the payee.


AUD

5

The Australian Dollar

This currency has over 8.6 percent share in daily currency transactions.
Till 1924, the Australian Department of the Treasury was in charge of issuing notes. In 1924, the Commonwealth Bank of Australia was given control over the issue of currency note.

...


Swiss Franc

6

The Swiss Franc

With over 5.2 percent of daily currency transactions, the Swiss franc takes the sixth spot.
Until the mid-19th century, cantons (states or provinces) and other entities were producing their own currency.  The Swiss National Bank was established after the introduction of the Federal Act on the Swiss National Bank in 1905. In 1910, the Swiss National Bank received its monopoly position in issuing money.


CAD

7

The Canadian Dollar

As the #7 currency in the world, the Canadian dollar has 4.6 percent share in daily currency transactions in the world.
The idea that government should issue currency started gaining support in the mid nineteenth century, but it was only in March 1935 that the Bank of Canada officially started its operations as the country’s central bank.

Peso

8

The Mexican Peso

The Mexican Peso has a 2.5 percent share in daily foreign exchange transactions and has been the currency of Mexico since the country got independent in 1821.
But Peso was first introduced into Mexico by the Spanish. Till 1785, it spread over almost all of the North America and gained status as the official currency system including United States.
Mexican currency is managed and issued by the central bank of the country i.e. Bank of Mexico.


CNY Yuan

9

The Chinese Yuan

With a 2.2 percent share in daily foreign exchange transactions, the yuan became one of the top 10 traded currencies in 2013, rising to No. 9 on the list due to a "significant expansion" in offshore trading, according to a report released by the Bank for International Settlements.
It's a sharp jump from the bank's last survey in 2010, when the yuan, known in China as the renminbi or "people's money," was No. 17 on the list.
China's central bank, People's Bank of China (PBOC) was established in 1948.

NZD

10

The New Zealand  Dollar

With 2 percent share in daily currency transactions,
the New Zealand dollar takes the #10 spot in the countdown.
New Zealand became a British colony in the mid-19th century.
The national currency was introduced in 1934 and, shortly after, the Reserve Bank of New Zealand (the country’s central bank) was created.


Source:
http://www.cbc.ca/news/business/chinese-yuan-among-top-10-most-traded-currencies-1.1703612


You may also like to read
Currency crisis in the Emerging Markets

Sunday, 8 December 2013

Leadership lessons from the life of Nelson Mandela


Nelson Mandela
Illustration by Manas Maisnam courtesy Kanglaonline.com
As the world pays tribute to the departed great soul, here are some quotes from
Nelson Mandela By Himself: The Authorised Book of Quotations

On life
What counts in life is not the mere fact that we have lived. It is what difference we have made to the lives of others that will determine the significance of the life we lead.

On death
Death is something inevitable. When a man has done what he considers to be his duty to his people and his country, he can rest in peace. I believe I have made that effort and that is, therefore, why I will sleep for the eternity.

On determination
Everyone can rise above their circumstances and achieve success if they are dedicated to and passionate about what they do.

On time 
I never think of the time I have lost. I just carry out a programme because it’s there. It’s mapped out for me.

Leadership Traits of Nelson Mandela

In an article in theguardian, Andrew Rawnsley wonderfully describes the leadership traits of Nelson Mandela that made him one of the greatest leaders of the world.
  • Nelson Mandela had natural charisma, grace, exquisite manners, sense of humour and an air of dignified command around himself.
  • His mission in life was to replace apartheid with democracy. He had the moral courage and clarity of purpose to relentlessly pursue this ideal.
  • He had a powerful sense of destiny, but what made him so very rare was that unlike many other politicians, he did not succumb to megalomania, nor did he elevate himself to the pedestal of a demi-god.
  • He was a rebel, a warrior against the established order. In old age, he liked to remind people that Rolihlahla, his given first name, means troublemaker. There would have been no Mandela, the healer, had he not been preceded by Mandela the fighter.
  • A lesser known aspects of his character is guile. His ideal of a democratic and free society was non-negotiable, yet on most other matters he was flexible, even opportunistic. Being a politician, being a human being, he had his frailties.  He was loyal to a fault to old comrades who were mediocre and corrupt.
  • Mandela did not punish others to affirm their own moral superiority. Mandela affirmed his superiority precisely by forgiving. He won over his enemies with respect, empathy, forgiveness and superhuman magnanimity.
Read the excellent complete article at
Last but not the least, I thank my friend Manas Maisnam for making this beautiful illustration and sharing it.

Friday, 6 December 2013

How to Manage Expectations


Source: www.howit.com


Very few people will dispute the fact that managing expectations is critical to the success of any relationship, be it a business relationship, a professional relationship, or a personal relationship. Managing expectations is all about setting the right expectations, communicating those expectations, and meeting the expectations.
A business that manages to balance the customers’ expectations with its product/service emerges successful. Failure to live up to the expectations of the customers, leaves them disappointed  At the workplace, employees are rated on how often they exceed expectations, meet expectations or fail to meet expectations; as such, at work people need to manage expectations at different levels. These include:

Setting expectations with your manager

How many times have you felt lost when you have been put on a job and nobody told you how to go on about it? If your manager does not give you clear instructions, it is necessary that you yourself approach your manager and ask specific questions that help you to understand what is expected from you. These could be questions on:
  • What is your role on the assignment.
  • Where to seek the resources such as information, training, tools, materials, space, money or people needed to do the assignment.
  • The expected schedule for reporting milestones and meeting interim deadlines.
  • What is the benchmarks for success at the milestone.
  • Guidelines or standards that need to be followed and boundaries that need to be adhered to.

Setting expectations with your clients

Businesses are run on the basis of relationship between a firm and its customers. As such it is very important for a business to know and cater to the expectations of their clients. For that every business needs to:
  • Anticipate the Client’s Needs.
  • Set expectations upfront while cutting down on the unrealistic expectations.  If you over promise and under deliver, people will be disappointed , but if you promise too little, people won’t try your product.
  • Manage expectations through constant communication.

Setting expectations within your team

Your team’s performance reflects your own performance. As such you need set expectations within your team and communicate those expectations clearly to steer your team towards the right direction.
  • Provide Structure, define boundaries.
  • Clarify roles.
  • Provide your team with resources that they need to accomplish their tasks to facilitate their work.
  • Set Motivational goals

Managing your own expectation

Last but not the least managing your own expectation is as important as managing expectations of your clients, your boss, your pears, your family or your friends. Your ability to manage your own expectations will shape your personal brand.
  • Set small achievable, measurable goals
  • Manage expectations of the outcome. Celebrate each small success but don’t let success rule your head or failure rule your heart.
  • Be persistent with your efforts. Step by step move towards the larger target.

Friday, 29 November 2013

Understanding random market behaviour


For an investor, the pain of selling a stock at a loss far exceeds the pleasure of selling the stock at an equal amount of gain.
Strange but true!
Such behavioral aspects of investing and many more are brought out in the study of behavioral finance, that was introduced in the late 1980s, owing to anomalies in stock price prediction by the two main existing theories of academic finance, i.e. Modern Portfolio Theory’ and ‘Efficient Market Hypothesis’.

According to the ‘Efficient Market Theory’, put forth by Eugene Fama, financial markets are believed to be efficient and investors are understood to make rational decisions. Further, market participants are supposed to be sophisticated, informed and known to act only on available information. Since market participants are believed to have equal access to information, it is implied that stock prices always reflect the best information about fundamental values of the stocks. According to the efficient market theory and Capital Asset Pricing Model (CAPM) the price of a stock is the Present Value (PV) of all the entire future earnings of the company i.e. the future dividend paid by the company. 

The ‘Modern Portfolio Theory’ pioneered by Harry Markowitz suggested that an investor can maximise returns by holding a diversified portfolio of assets with different levels of risk.

However stock prices were found to exhibit more volatility than efficient market hypothesis could explain.  The market price of a stock often grossly varied from the price arrived at by efficient market theory.  This unexplained volatility and the difference between the market price and the rational price of the stock became a subject of research. It was also found that as compared to the individual stocks, the aggregate stock price (index) showed a higher variance from the values predicted by the efficient market theory.

The research brought out interesting aspects of behavioural finance. In the paper ‘From efficient market theory to behavioral finance’, Robert J Schiller explains the reason for the apparent randomness in the movement of stock prices using models such as feedback model, smart money versus ordinary investors and prospect theory.

Feedback model

As expectations of rise in a stock price increase, more and more people start buying the stock. As a result a momentum sets in, which takes prices farther away from the levels predicted by the academic finance models. Similarly when there is an expectation of a fall in price, more and more people join in to sell the stock, driving prices lower than supported by the financial models. This is one of the strong reasons for bubbles and bursts. Feedback may be one of the essential sources of the randomness seen in stock prices.

Obstacles to smart money

Recognizing the difference between smart money and the ordinary investors, the efficient markets theory asserts that when the irrational optimist buys a stock, the smart investor sells and vice versa. However in reality every investor has the shades of an ordinary investor and a smart investor.  Many times when most owners of a stock are too optimistic about a stock, they may not be willing to lend shares to short sellers; so there may not be enough shares available for short selling.  The lack of short selling can push the stock price further upwards, amplifying  the effect of irrational optimism and can cause financial anomalies in bubbles and bursts.  

Prospect Theory

Prospect theory is used to explain deviations from the traditional paradigm of rational behaviour. According to this theory since people value gains and losses differently, an investor feels more difficulty in selling shares at a loss than the exuberance the person experiences when selling the stock at an equal amount of gain.


Understanding how other market participants may act can help investors in making good investment decisions. Traders often experience a varied range of emotions from exuberance to despair during different stages of a trade with abrupt changes in the stock price movement, with negative emotions weighing much heavily than the positive emotions. Viewing the random and unexpected market movement in light of behavioral finance theory can prepare investors better to ride out the volatility by inculcating trading discipline, while minimizing the emotional impacts. It can prevent investors from buying overpriced shares or from dumping oversold but still valuable stocks at a huge loss seeing other investors rushing for the exits and thus avert committing gross wrong trades that are to be regretted later.


Monday, 14 October 2013

Bottlenecks plaguing the coal sector in India

The import of coal has been one of the significant factors contributing to the Current Account Deficit (CAD) in India that touched 4.8 per cent (approx USD 88 billion) of India’s Gross Domestic Product (GDP) in 2012-13 period. Rising imports, coupled with fall in value of rupee, resulted in a drain of foreign exchange from the country. It is surprising to note that although India has the fifth largest reserves of coal in the world totaling up to 235 BT in 2011, the gap between production and consumption of coal has been increasing over the years from 72 MT in 2009 to 82 MT in 2011. India imported around 135 MT of coal in the 2012-2013 and is currently the second larger importer of coal after China.

Here we look at some of the issues pertaining to the coal sector in India.

Issues related to import of coal

India needs to import substantial amount of coal from countries like Australia, New Zealand, South Africa and Indonesia. Indonesian coal accounts for a bulk of India’s thermal coal imports, while steel-making coking coal is imported largely from Australia and South Africa. Owing to the increase in environmental concerns, coal exporting countries such as Indonesia imposed coal tax and Australia levied carbon tax in 2012.  The imposition of taxes increased the cost of coal for the plants in India that are especially designed to use imported coal, This resulted in power producing  companies such as Tata Power and Adani Power to demand for rate revision in their power purchase agreements (PPA). However the government upheld the PPA, while agreeing for a temporary upward revision in price in some cases.

Issues related to domestic production of coal 

Domestic production of coal is beset with challenges both in terms of quality and quantity. Problem of quantity relates to environmental, rehabilitation and technological issues in opening up of new mines and in increasing recovery from currently operating mines. Sustainable solutions are needed to address the environmental and rehabilitation concerns. Since most of the coal deposits lie underneath forests and tribal regions, mining requires felling of forest and resettlement and rehabilitation of affected people. Mining in such areas, if left uncontrolled, can cause environmental and social havoc. Environmentally sustainable mining is costly which is bound to reflect on the cost of electricity. Increasing prices of electricity is as much a political decision as a business one.
By and large, domestically produced coal has problems associated with grade and ash content. The Indian coal mines produce coal that has higher ash content, and hence more impurities, which increases the cost of cleaning, High ash content imposes a limitation to that coal being used in metallurgical processes. Around 70% of the coal in India is used to produce power and around 7% of the coal is used in the steel industry. Though the high ash coal can be used in power plants, but it produces substantial quantity of ash (both solid and fly), thus increasing the costs associated with cleaning and storing such ash. Additionally plants have to invest in capturing fly ash to adhere to flue-gas emission standards. Some older power plants also have limitations of space required for disposing ash. High ash content increases the cost of transportation per unit energy value of the fuel, further increasing the cost of production of electricity and metallurgical process. There are technological issues associated with plants which have been designed to work on lower ash content. Local coal needs to be blended with imported low ash content coal for use in such plants.
Coal India Ltd (CIL) is the only public sector company that mines and sells coal in the local market. In addition some companies like steel and power companies have their captive mines. Of late, due to supply constraints, CIL has not been able to fulfill the domestic requirement of power plants, after entering into Fuel Supply Agreements. Further, FSAs are waiting to be signed with many other power companies that are under development or have been awarded permission to set up new power plants. Domestic coal demand touched 772.84 million tonnes (MT) during 2012-13 period whereas production was at 557.60 MT. In the wake of the local shortages, coal imports have been increasing and are projected to increase further.

Issues related to government policy on coal allocation

In 2012, the policy of the Government of India on allocation of coal blocks came under scanner due to allegations by the Comptroller and Auditor General of India (CAG) office, accusing the government of allocating coal blocks in an inefficient manner during the period 2004–2009. In spite of the government’s policy to open coal sector to private players, the coal allocation has been ineffective and has created a situation where coal is not available to power generators as and when required. On one hand few generators are occupying huge mines, whereas the newer ones are not able to start mining as they still haven’t got the mandatory clearances.
This has put the burden for supplying coal on CIL, the sole public sector coal producer. Current slowdown in the economy has adversely impacted the power producers as plant load factor (PLF) has reduced and short-term power rates are depressed. Rupee’s slide against the dollar has further driven up the cost of imported coal. The Indian buyers of coal are unwilling to shoulder the additional cost burden, and have cancelled contracts or sought to renegotiate contracts, causing coal cargoes to pile up at Indian ports. As nearly 60 % of country’s electricity generation is from coal-based plants, better power prices would have incentivized power producers to purchase costlier imported coal for generating more power.

All these factors have added to the increase in demand and supply gap, and have been deterrents in the country’s progress towards energy sufficiency.


Related articles


You may also like to read


Wednesday, 18 September 2013

Monetary Policy and Inflation

The announcement of monetary policy is awaited by businesses and investors alike, who are eager to know the impact of the change in policy on their savings or on their business. Here we look at how monetary policy impacts the economy.The objective of Monetary policy is to control the supply of money to boost economic growth while keeping inflation within acceptable limit. 


Some tools of monetary policy that are used by the central banks are: 


1.      Lowering of short-term Interest Rates
This is the first tool used by the central banks around the world. When interest rates are lowered, it becomes cheaper to borrow money and less lucrative to save.  This brings about a decline in savings; individuals and corporations are encouraged to spend, more money is borrowed, and more money is spent, thus increasing the overall economic activity.

2.      Open Market Operations: Under OMO, the central bank buys bonds (from banks or general public) in the open market.  By exchanging bonds for cash, the central bank increases money supply in the economy. Due to increase in the supply of money relative to demand, money can be borrowed at lower interest rates. This means that the short term interest rate for borrowing decreases. Conversely, if the central bank sells bonds, it decreases the money supply, drains liquidity and increases short term rates. Different countries have different ways of conducting OMOs. In India, effective instruments for OMOs are Liquidity Adjustment Facility (LAF) and Market Stabilization Scheme (MSS). Repo and Reverse Repo rate constitute the LAF system. Securities purchased and sold in OMOs are dated securities, T bills.

3.      Reserve Requirement: The central bank has the ability to adjust banks' reserve requirements, which determines the level of reserves a bank must hold in comparison to specified deposit liabilities. By adjusting the reserve ratios, the central bank can increase or decrease the amount of money that banks can lend.

4.      Quantitative Easing: When interest rates are near zero but still the economy remains stalled, then central banks start supplying money from their reserves to the financial institutions by purchasing assets. The central bank purchases assets (government securities or other securities from the market) by spending the money it has created.  Through QE, the central bank increases the quantity of money supply and that results in increased spending and in increased consumption, which increases the demand for goods and services, fosters job creation and, ultimately, creates economic vitality. Quantitative easing is generally used a last resort by policy makers. Though both QE and OMO involve purchase of assets, but QE involves purchase of longer duration assets, and mortgage backed securities.

  
Image Source 


Other effects of monetary easing:

  • Since it takes time for productivity to increase (due to policy bottlenecks, lack of infrastructure, technology constraints etc), till the time productivity increases, supply of goods and services remains more or less the same. So with more money available to buy a finite set of products, prices go up, resulting in inflation.  For this very reason, central banks tend to hold back rate cuts or even hike interest rates when inflation data is high.
  • When the interest rates on bank deposits go down, investors move to the stock market and buy shares in hope of higher returns. As a result markets tend to react positively to the news of a interest rate cut or to QE. But, when continued for a long time expansive monetary policy has led to creation of bubbles in stock markets and real estate markets, as had happened in Japan in the early 1990s. Withdrawal of QE, takes cash out of circulation and tightens the money supply. That is the reason why markets react negatively to the news of reduction in QE. 

Related articles